Investigating population structure with ADMIXTURE
Our goal here is to analyze the distribution of multi-locus genotypesto define genetic pools (i.e., populations) and to make predictions about the most probable population of origin for each individual. Several tools have been developed for this purpose, and we will use here ADMIXTURE, which ultimately produces a maximum likelihood estimation of individual ancestries from our SNP dataset by implementing a fast numerical optimization algorithm. This approach is based on independent (i.e., unlinked) SNPs, so we will need to first select the loci accordingly.

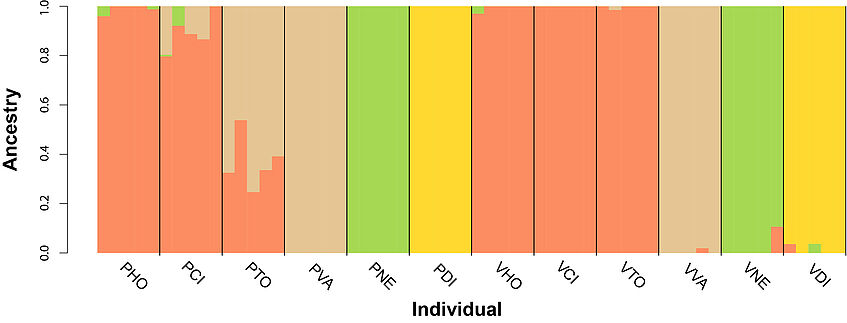
The assignment of each individual to a population is quantified and visualized in terms of the proportion of ancestry from each gene pool present in the data. A key user-defined parameter is the hypothesized number of populations of origin which is represented by K. Sometimes the value of K is clear from the biology, but more often a range of potential K-values must be explored and evaluated using a variety of likelihood based approaches to decide upon the best K value. ADMIXTURE uses a cross-validation procedure by breaking the samples for each K into 5 equally sized portions. It then masks one portion in turn, trains the model to estimate the allele frequencies and ancestry assignments on the unmasked accessions, and then attempts to predict the genotype values for the masked individuals.
ADMIXTURE assumes that each SNP locus is independent, so we don’t want to output multiple SNPs from the same RAD locus, since they are not independent but are in linkage blocks within each RAD tag. We can achieve this by specifying the --write_single_snp parameter to populations.
cd ~/RADlecture/
populations -P ./stacks/ -b 1 -M ./popmap -t 4 --vcf --write_single_snp
ADMIXTURE will however need the data in a special format (i.e., .ped) and reformatting the vcf to .ped is a bit tidious and will not be covered here. So we start from an already prepared file. This is a white-space delimited file that includes from column 7 onwards the genotypes as any character, except 0 which is used by default for missing data.
cd ~/RADlecture/admixture/
head -2 input.ped
We will run ADMIXTURE for K values from 1 to 10 with a bash script that is already prepared.
cat ~/RADlecture/admixture/admixture.sh
sh admixture.sh
cat K_CV.log
The last command will display the cross-validation (CV) error for each K. We need to select the K value that will minimize the CV value. Finally we plot the results in rstudio.
setwd("~/RADlecture/admixture/")
bestK <- read.table("input.X.Q")
ind <- read.table("popped")
individuals <- paste0(ind[,1])

pdf(file = "~/RADlecture/admixture.pdf", width = 20, height = 5)
barplot(t(as.matrix(bestK)), col=c("#FC8D62", "#A6D854", "#FFD92F", "#E5C494", "#B3B3B3"), space=0, xlab="Individual", ylab="Ancestry", border=NA)
abline(v=cumsum(sapply(unique(individuals),function(x){sum(individuals==x)})),col=1,lwd=1.2)
text(tapply(1:nrow(ind), ind, mean), -0.05, srt = -45, unique(individuals), pos=1, xpd=T)
dev.off()
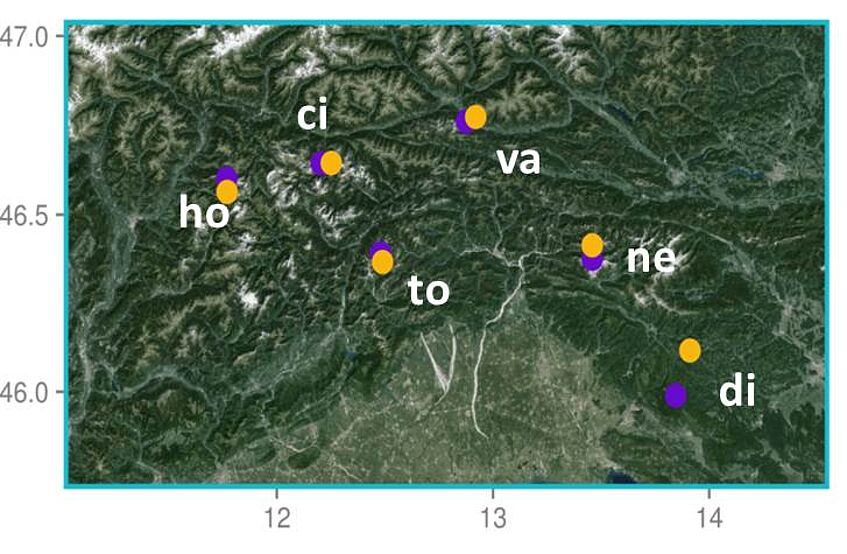
- Are the populations of each ecotype at each mountain related to one another? How can you tell?
- How much gene flow is there between the different genetic pools?

