Quality assessment of sequence data
Modern sequencing technologies can generate a massive number of sequence reads in a single experiment. However, no sequencing technology is perfect, and each instrument will generate different types and amounts of error. Therefore, it is necessary to understand, identify and exclude error-types that may impact downstream analysis.
Our objective here is to understand some relevant properties of raw sequence data. We will focus on properties such as length, quality scores and base distribution in order to assess the quality of the data and discard low quality or uninformative reads. There are a 100 ways to do the steps included below, but we give here only examples.
Open a terminal with shortcut Ctrl + Alt + T or click the terminal icon.
Navigate to the lecture home with
cd ~/RADlecture
Checking Heliosperma Illumina RAD data with FastQC
The goal of this exercise is to inspect the Illumina sequence quality of a few accessions. Let's have a look with fastqc at the Heliosperma RAD data from ~/RADlecture/samples/PCI16.1.fq.
If time permits look also at other 1-2 individuals
Start FastQC by typing
fastqc
Load the respective file from the folder RADlecture into FastQC (File -> Open). You can view the results either within the FastQC application or you can export a report for later view (File -> SaveReport). Think about the following aspects:

- Have a look at the numbers output on the “Basic Statistics” page. How many sequences do we have? What is the sequence length? And the GC content?
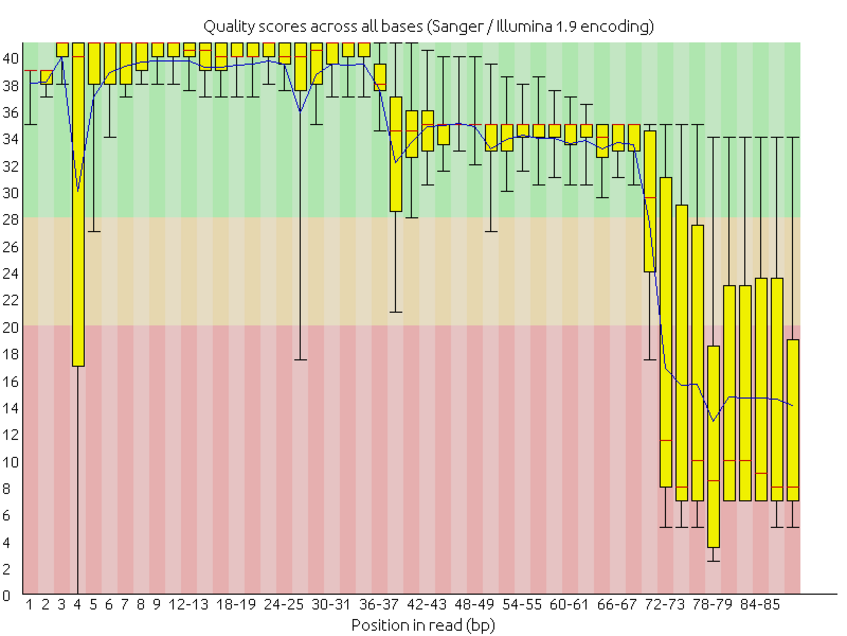
- Examine the “Per base sequence quality” and ”Per sequence quality scores”. FastQC points out a “problem” with a red X and a “potential problem” with an orange !. Do you think this run gave good quality sequences?
- Examine the “Per base sequence content”, “Per base GC content” and “Per sequence GC content” pages. Do you think we should worry about it in this particular case?
