Phylogenetic Methods
Software and data sets
Before starting this practical, the software needed and example data must be downloaded onto the computer. Installation instructions for Phylip can be found here. Please unzip the data folder and copy the input files inside the phylip folder where you have the programs (for example where dnapars is).
Programs
We will play with the following programs:
- njplot, a simple program for visualising trees.
- dnapars, protpars, the PHYLIP programs implementing Maximum Parsimony methods for DNA and protein sequences, respectively.
- dnadist, protdist, the PHYLIP programs for constructing distance matrices from DNA and protein sequences, respectively.
- neighbor, the PHYLIP program that implements the Neighbor Joining algorithm for reconstructing a tree from a distance matrix.
- phyml, an efficient implementation of Maximum Likelihood methods.
PHYLIP is a free package of programs for inferring phylogenies.
Data Sets
Yeast genes
The first data set for this tutorial has been taken from a phylogenetic study about the Yeast genus Saccharomyces. This study was published in:
Rokas A, Williams BL, King N, Carroll SB 2003. Genome-scale approaches to resolving incongruence in molecular phylogenies. Nature 425, 798-804.
For the tutorial we reduced the study to a toy example of 8 genes taken from 7 Saccharomyces species (S. cerevisae, S. paradoxus, S. mikatae, S. kudriavzevii, S. bayanus, S. castellii and S. kluyveri) and the outgroup fungus Candida albicans. Normally, for each gene, you would have to produce multiple alignments of the sequences from these 8 species and subsequently concatenate all the alignments into one data set. We have already done this for you. The multiple alignments for the 8 genes are in the following files: yeast1.txt, yeast2.txt, yeast3.txt, yeast4.txt, yeast5.txt, yeast104.txt, yeast105.txt, yeast106.txt. We have also an alignment with all of the above genes concatenated. It is stored in yeast_all.txt.
Maximum Parsimony
Start the program dnapars by double-clicking on the icon for this program (in the folder you created). The safest (because in case of problems in the execution you will be able to read the error messages) is to use the command prompt, by typing
./dnapars
You will then be asked to enter the name of the alignment file. Type
> yeast1.txt
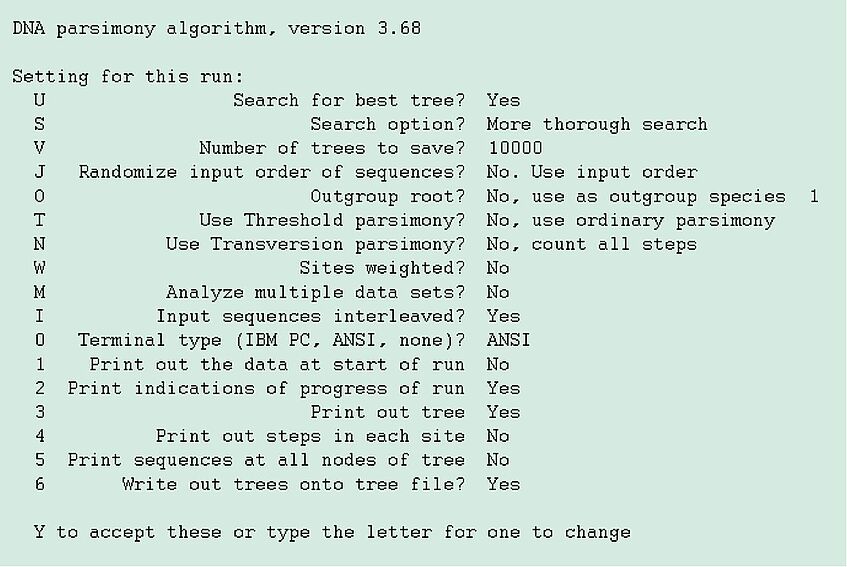
and dnapars displays an interactive menu of options. The menu looks like shown on the left.
The user either enters "Y" if the settings shown are to be accepted, or the letter or digit corresponding to an option that is to be changed. You can try and change some of the options, but if this is the first time you use PHYLIP you should perhaps run the program with the default settings.
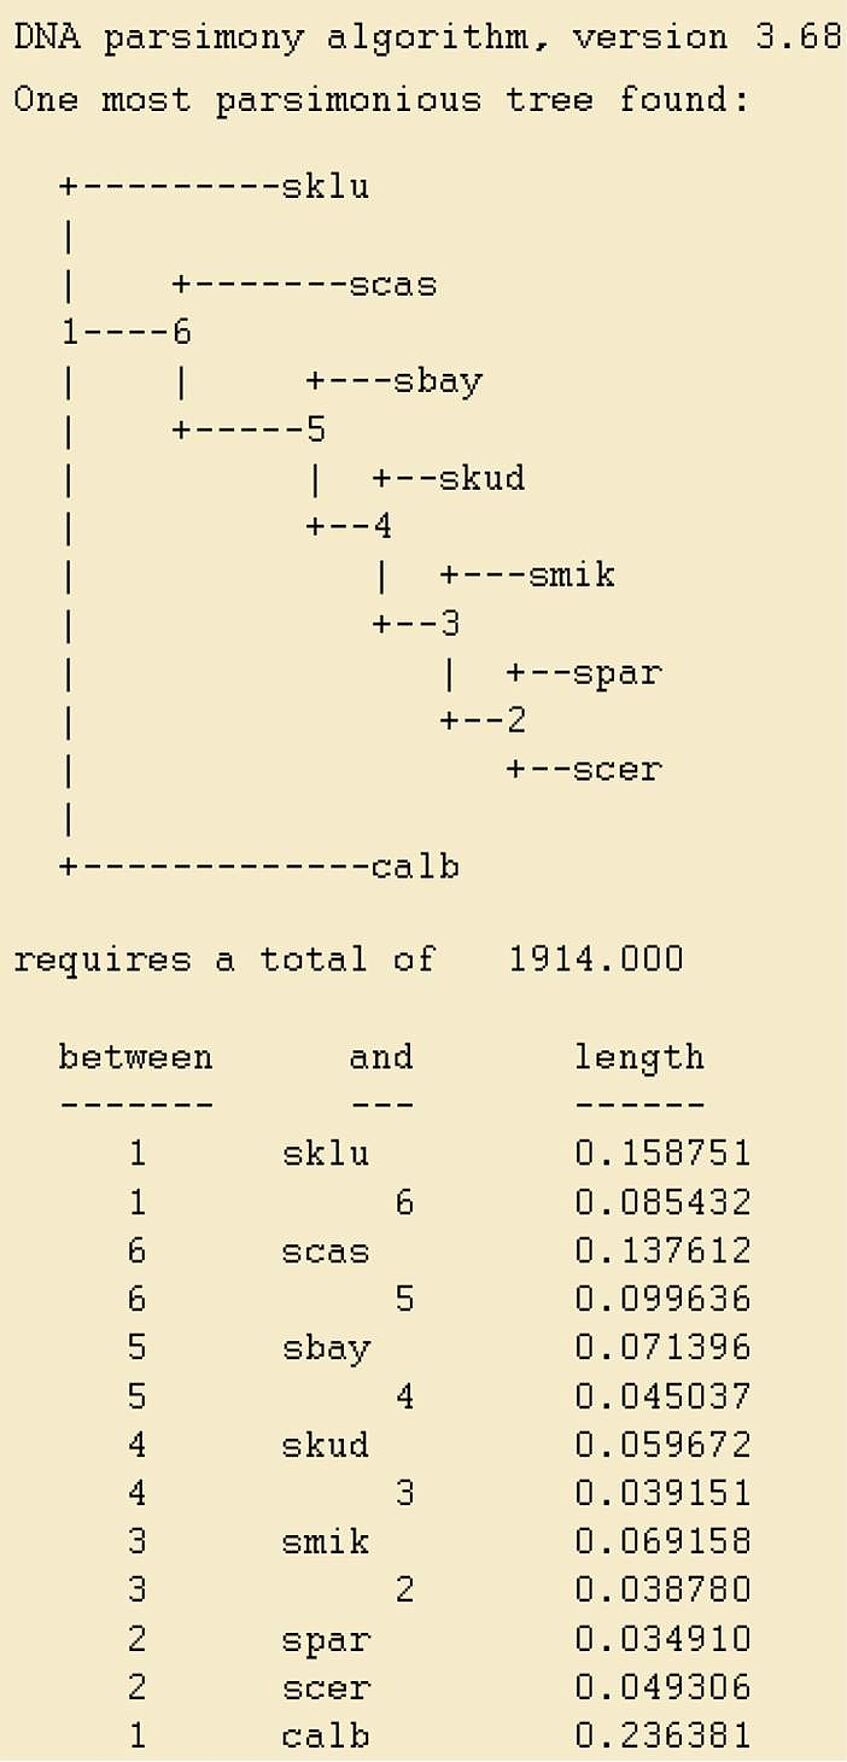
After typing "Y" and hitting return the program will run and, if everything goes well, the results are stored in a file called outfile. In order to open this file you can use any text editor, such as Notepad. (Right click on the file and select "Open with"). Its contents should look like shown on the right.
The output tree is drawn on screen, but also stored in the so-called Newick format in a file called outtree. If you feel particularly adventurous, you can look at the contents of this file and try to understand how the Newick format works. The answer is here. (But don't waste time on this, there is more interesting stuff ahead).
IMPORTANT: An annoying thing about all the programs in PHYLIP is that their outputs are always stored in outfile and outtree, so you should always rename these files in some meaningful way, e.g. as yeast1-pars.txt and yeast1-pars.tree. If you don't, the neighbor program, which we will use next, will open outfile and outtree as output files too, thus erasing their contents
- Q1. Produce a maximum parsimony tree using yeast104.txt. Did you obtain the same tree as here?
Visualising the Phylogenetic Trees
The output trees you have obtained above can be visualised by opening them with Njplot.You need to double click the icon in your folder in order to start the programme.
Since the tree is in reality unrooted, when it is drawn as a rooted tree, the choice of the root is totally arbitrary. That explains why the tree that you are looking at may seem different from the one that was drawn by dnapars.
The position of the root can be inferred by using one (or more) "outgroup" species which do not belong to the group composed by all the other species. For example, here we know with certainty that Candida albicans does not belong to the genus Saccharomyces. Therefore we can be confident that the root of this tree should be placed on the branch connecting Candida albicans to the common ancestor of all Saccharomyces.
This information can be used in njplot (actually also in all PHYLIP programs (option "o")) by specifying the species to be used as outgroup: select the New outgroup operation and then click on the # close to Candida albicans. This should make the drawing much more similar to the one reported by dnapars (to make it identical you may need to use the Swap nodes operation).