Maximum Likelihood
We will use phyml online and specify yeast1.txt as input file.
As for the calculation of distances, the calculation of likelihood depends on the evolutionary model assumed. An evolutionary model specifies things like the relative probability of different substitutions (e.g. A -> G is usually more likely than A -> T), and the distribution of the substitution rates at different sites along the sequence. The reason why the calculation of the likelihood depends on the chosen evolutionary model is simple. The likelihood of a tree is defined as the probability of the data given that tree. The way this probability is computed strongly depends on what evolutionary changes are considered to be probable or improbable, i.e. on the evolutionary model.
Most options that need to be set by the user are about different aspects of the evolutionary model. In the next lecture we will discuss the variety of models available (but for now see the schema reported in the appendix below). One should be aware, though, that more realistic models of evolution often lead to more accurate tree reconstructions, and therefore should be preferred.
The Jukes-Cantor (JC) model, which assumes that all nucleotide changes are equally probable, is arguably the worst possible model, but for reasons of simplicity, this is the model we will use today. Chose JC69 for the substitution model. Include your email address and submit the job.
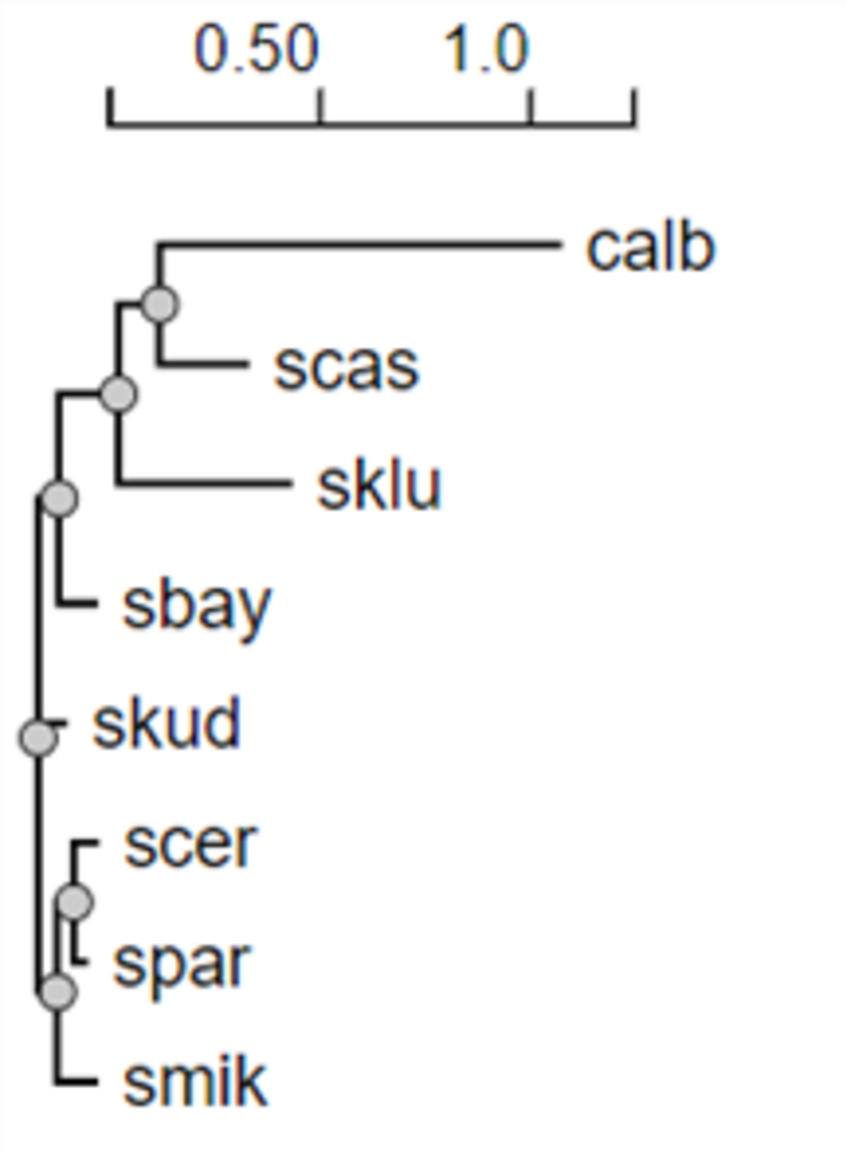
phyml produces several files that you will receive by email: yeast1.txt_phyml_tree.txt, yeast1.txt_phyml_lk.txt and yeast1.txt_phyml_stat.txt, which respectively report the maximum likelihood tree in Newick format, the likelihood of this tree and the settings that were used for running the program.
Unlike PHYLIP programs, phyml does not directly produce a text representation of the maximum likelihood tree, but the sent email has a link to Presto, a tree visualization program.
- Q3. Anything surprising?
- Q4. Repeat the above on files yeast104.txt and yeast_all.txt. Which do you think is the true tree relating these 8 species?
Appendix: Models of DNA Substitution
Models of DNA substitution specify the rates with which nucleotides change into other nucleotides. They are just one aspect of evolutionary models. See also the wikipedia entry for this.
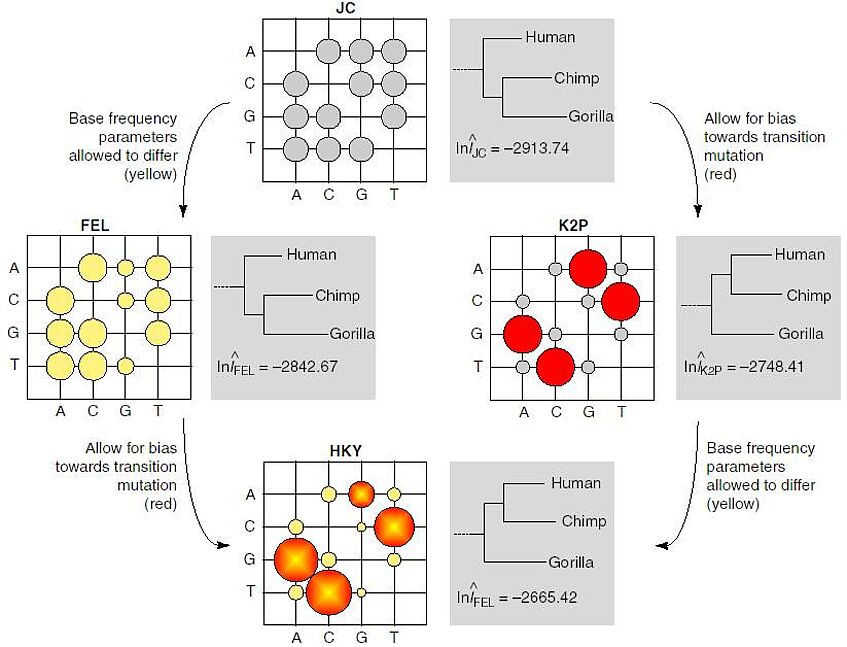
- Jukes-Cantor (JC, 1969) proposed a stochastic model for DNA in which each base is substituted by any other at equal rate.
- Kimura (K2P, 1980) described a model that considered the difference in transition and transversion rates.
- Felsenstein (FEL 1981) introduced a model in which rate substitution to a nucleotide depends only on the frequency of that nucleotide.
- Hasegawa and colleagues (HKY, 1985) implemented transition/transversion bias in Felsensteins model, effectively combining it with the model of Kimura.
- The most general models can have at most 12 independent parameters; insisting on reversibility (REV) reduces this to 9. REV was considered by Tavare (1986) and later by Yang (1994).
These models are often represented in the form of an instantaneous rate matrix, whose entries are the relative rates of nucleotide replacement. The schema visualizes some instantaneous rate matrices as a bubble plots (Figure taken from Whelan & Goldman, 2001). Large bubbles indicate common replacement between nucleotides (e.g. A and G), small bubbles indicate rare replacement (e.g. A to T).
Acknowledgements
The excercises here have been developed following similar excercises modified by Carolin Kosiol, originally formulated by members of the Goldman group (EMBL-EBI) and Aidan Budd (EMBL Heidelberg).