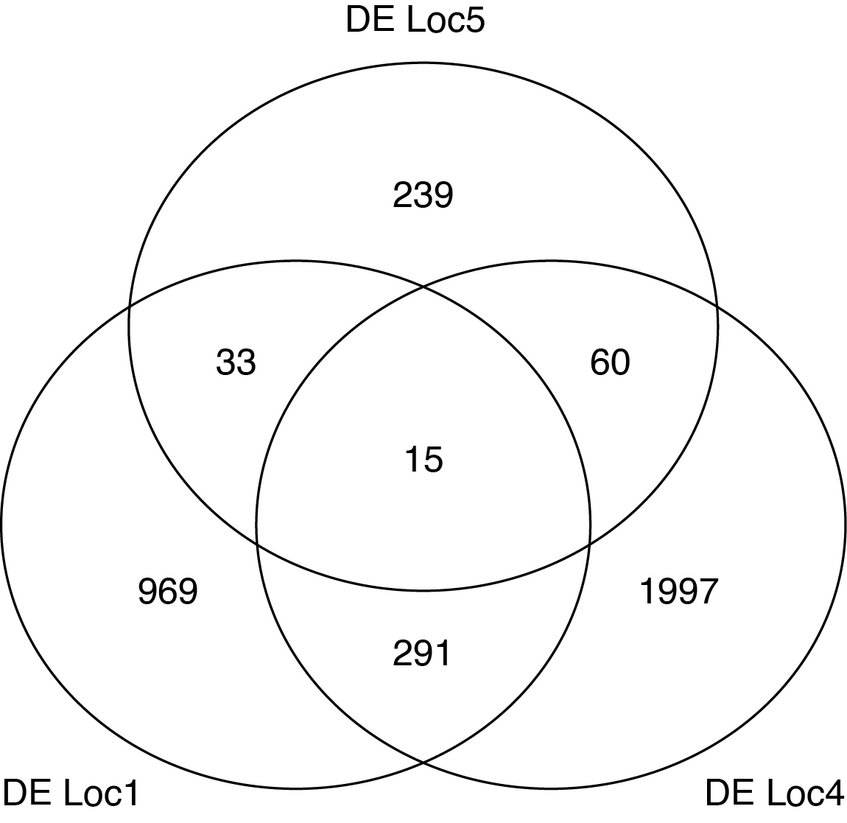
Quantifying overlap with a Venn diagram
We can quantify the amount of overlapping differentially expressed genes between the different localities. This is useful to understand if the divergence events are independent of each other (less overlap expected), or if there are forces at work that will act towards homogenizing the differences between different histories.
In the terminal (i.e., outside R), prepare a list with the DE genes for each locality, like:
sed 's/"//g' YourName/Loc1/DESeq2Res05Loc1.txt | cut -f 1 -d " " | tail -n+2 > list1
Then in R:
> library("gplots")
> list1 <- read.table("list1", header=F, row.names=NULL)
> list4 <-read.table("list4", header=F, row.names=NULL)
> list5 <-read.table("list5", header=F, row.names=NULL)
> venn.lists <-list(list1, list4, list5)
> names(venn.lists) <-c("DE1", "DE4", "DE5")
> pdf("Venn.pdf", width = 8, height = 8)
> venn(venn.lists)
> dev.off()
> q()
- Is the overlap between all pairs of localities relatively equal?
- Which forces do you think could play a role in homogenizing the differences between alpine and mountain ecotypes at different localities?